| Home Tcl |
XOTclIDE - new life for Tcl.
|
This approach of Tcl-debugger try to serve full debugging possibility by extending Tcl-core and a special Tcl-extension (in C). The target is full graphical debugger that is also programmed in Tcl (and Tk).
I have tried to find out every possible requirements to debugger. The most of them are unknown for standard (c, c++, Java ) debugger. The target of such debugger is not only to allow to inspect and observe the program flow with all aspects (variables, frames, execution place) but also to allow the programmer to control and change the program flow by changing variables, skipping commands and the least to rewrite the method, recompile it and let it run again.
Such debugger should also be invoked in error case. The programmer should have the chance to inspect all program context that caused the error. The standard Tcl error handling drop in error case all frame (call stack) information and go to most global level. In the fact there would be generated an error trace protocol. But this is often not enough to understand the error. It does not contain the values of local variables and parameters. In the ideal cause in the error case the programmer should have the chance to modify the method (syntax errors) and rerun program without dropping actual program context.
Here a list of requirements:
By the way. The most of this functions are available in Smalltalk debuggers (as standard or extension)
In 2nd Step you must build the debugging extension atkdebugger. The configuration is based on TEA2. To test the debuging-extession invoke test.tcl in dictionary tests. Do not forget to use your patched Tcl.
Tclsh-with-debug test/test.tcl
cd ~
mkdir tcldebugg
tar xvzf ~/downloads/tcl8.4.5-src.tar.gz
cd tcl8.4.5/generic/
patch <~/downloads/tcl8.4.5-atkdebugger.patch
cd ../unix
./configure --prefix=${HOME}/tcldebugg
make
make install
cd ~
tar xvzf ~/downloads/atkdebugger-0.21.tar.gz
cd atkdebugger-0.21
./configure --with-tcl=${HOME}/tcldebugg/lib
make
make test
make install
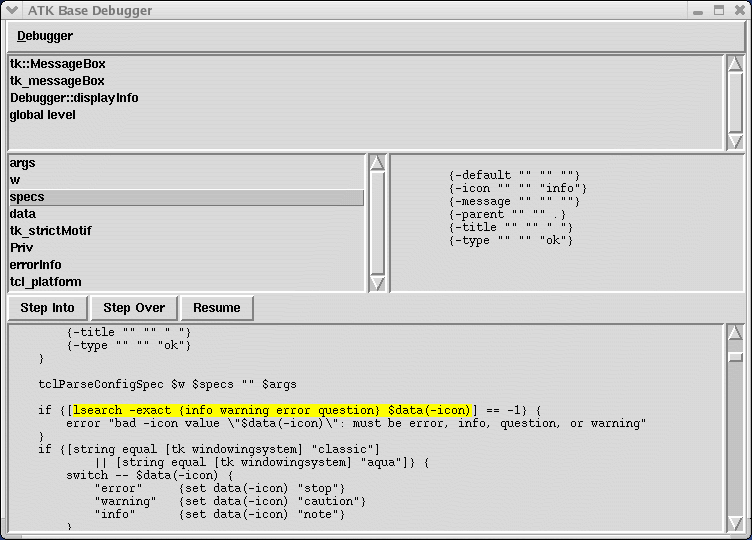
The are one simple Tk-Debugger GUI in the dictionary "test ". To start a simple debug-session invoke script sample-debug-session.tcl. You can use this simple debugger GUI also your own programs by including the debugger.tcl source.
In this sample the debugger will be invoked several times.
tests/debugger.
and can be used from command line as
/opt/tcl843-debug/bin/tclsh8.4 tests/debugger.tcl tests/sampleprog.tcl
You can also use wrapped tclkit above

The debugger extension was primary written to extend XOTclIDE with full debugging futures. To use the debugger you do not need XOTcl but yet only XOTclIDE contains full IDE to support this debugger.
There are object-oriented facade in XOTcl (see Component IDE::ExtendedDebugger). The are also full integration of the debugging in this IDE with showing and setting breakpoint directly in source code. See for more information
all tcl-command are programmed in atk namespace. The most important command is atk::debugproc it will be used to set Tcl-script that will be evaluated by debug invocation.
The main idea was to write Tcl-debugger in Tcl. Only the special introspection and debug-flow command are written in C.
The requirements nummer 1 2 4 and 5 are simple to implement with core Tcl. Tcl have indeed very good introspection capabilities. The command info level we can ask the actual level number. With info locals and uplevel we can show and change all program context. XOTclIDE simple debugger implements such base deguging in pure tcl (xotcl).
The first difficult things is to show the place where the program flow stop. In the base approach we can use info level command to find out the procedure name and info body to get the source body. We can also scan the lower level source body (foo1 body) after the upper level command name (foo2).
Example
proc foo1 {} {
  puts "foo1"
  foo2
  puts "end fool1"
  foo2
}
proc foo2 {} {
  # next procedure invoke debugger
  atk::halt
}
This do not work if the fool2 is invoked by eval or indirect (variable substitution). Indeed Core-Tcl offer no solution for this problem. We are sure that this information are in tcl-interpreter because in error case the info (execution point in source with line number) are dumping into errorInfo global variable.
Near look into Tcl source code gives the answer. The Problem is the TclExecuteByteCode(Tcl_Interp *interp,ByteCode *codePtr) in file generic/tclExecute.c. To get the actual execution point in source code the local function GetSrcInfoForPc will be used.
The actual program counter (PC) are stored as local variable in the procedure scope. It is not possible to access the PC from higher frame level. I have extended the Frame structure to store also the program counter in it.
Tcl have intern two kinds of code execution. The one is bytecoded (TclExecuteByteCode in file tclExecute.c) and the another is list evaluation used for global context and scripts evaluated with eval command (Tcl_EvalEx in tclBasic.c). The another proble is the coding of frames (levels). The global frame has no internal frame so debugger must implement internal that four cases.
Another difficult function are the breakpoints. Indeed breakpoint sould simulate command atk::halt in specified method and place. The user specify the method name and the char count in the source. The point to do it are in the our famous procedure . The procedure for checking Breakpoint are delegate throw function pointer in structure Interp->atkdebugger-> to debugger extension. If one breakpoint are matched the procedure simulate the atk::halt command.
The invoking debugger in error case is also not so easy. The Tcl-Core error procedure search for closures at its level, when not found it drop all context information (after making some logging into errorInfo) and jump be return to lower level. At global level the error handling procedure are invoked, be all we have at the moment are rare information in errorInfo.
It is not possible in Tcl-Core to find out if the lower level frame have catch procedure That means we do not need to invoke debugger. The error closures information are also stored in the scope of TclExecuteByteCode procedure.
The invoking the debugger in error case should also first check if there are catch blocks in lower frames if not (it will cause error execution) it should invoke debugging proc at this frame.
Atkdebugger is designed in 5 levels
In the atkdebugger file only 3 levels are included. Last 2 levels are a part of XOTclIDE.
In Tcl-Interpreter are two modes and places that execute Tcl-Scripts on is TclExecuteByteCode in generic/tclExecute.c that execute byte-code compiled procedures. The another one is TclEvalObjvInternal in generic/tclBasic.c that is use to execute evaluated (eval, upvar) scripts and global context scripts.
Tcl have very good C-Level API but there are no API to the interpreter, that can be used to build debugger (as in Smalltalk). The heart of interpreter it is the byte execution procedure is write as one very long (switch) function with some goto jumps. Of course there is also accessible (in Tcl 8.3) command trace possibility. It can be good to notice some command execution (function call counter) but is not good to build something like step or introspection of execution place. It will also not work by byte compiled commands. It is very seldom why to the idea of flexible dynamic interpreter was not fully realized in this place. Another languages keep all execution context (PC) in special structures but Tcl-Core use for it local variables of some function.
It can be some help to refactor the procedure TclExecuteByteCode by splitting it in one method per byte code and use jump table instead of on big switch and hold all context in special structure. By near look it can be not so easy because of many jumps. It can be also useful to dynamic extend the byte code, which was also discussed by Tcl-WiKi. I have not verified it yet.
The most changes are made in procedure TclExecuteByteCode in generic/tclExecute.c file. Also the internal structures Interp and Proc was extended. I have marked all places with the comment /* atkdebugger */ so you can easy find them out.
All atkspecific canges are closed in #ifdef atkdebugger precompiler conditional so you can even after appling the patch compile tcl in old mode.
The program was written by Artur Trzewik and is GNU Public License Software.
Artur TrzewikLast modified: 2007-03-15