Debugging
Debugger and extended Debugger
XOTcl have two browsers suitable for debugging. Up from Version 0.39 XOTclIDE support an extended debugger based on atkdebugger. This debugger can be loaded into IDE as add-ins. (See the Section called Extended Debugger)
Debugger Browser
This Browser let you stop the program flow in one point and view calling stack method and local variables. To set a break point call halt method
[self] halt |
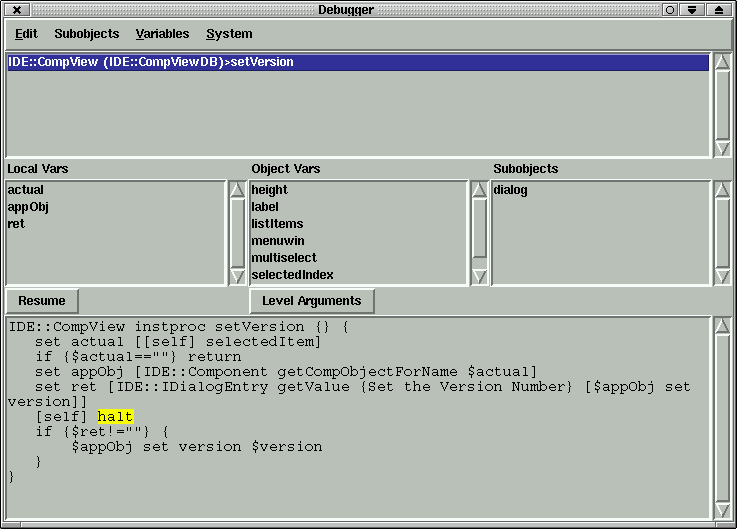
The comfort function as stepping throw methods, setting break points per editor are implemented only in extended debugger.
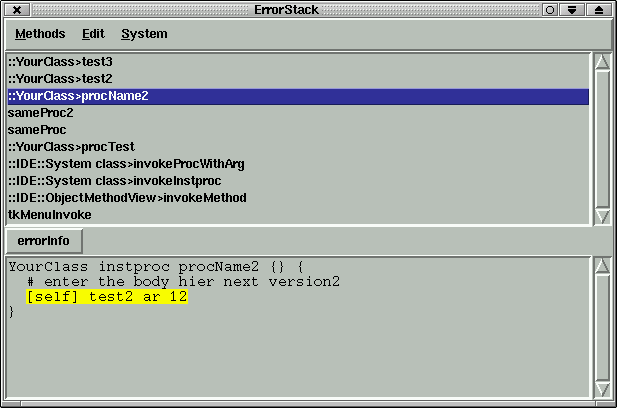
Stack Error Browser
This browser is can parse the error stack info "errorInfo". XOTclIDE modify the bgerror method and add new button to standard error message (XOTclIDE browser). Tcl do not let to inspect the calling stack by errors. So there are all information that are possible by error. You can also view (Button errorInfo) the original errorInfo. The browser try to highlight the called methods. By extended debugger the error cause the invoking of debugger direkt in error place.
Tracker Browser
This is a GUI for something like tracker known from XOTcl package xotcl::tracker. So you can track calls to every objects for chosen class. To Track some class select menu "Track Class" from Class Menu in Component Browser. You can customize the tracker to show
only methods entry or exit points
ignore internal call. Form the same object
do not show arguments or return values
do not show calling information