Extended Debugger
This debugger is based on atkdebugger Tcl extension. To use it you need this C-Extension that anyway need a patch for Tcl-Core. It this time this patch is only available for Tcl8.4.1 (works with 8.4.3 too). This debugger support really fast step into and step over commands and can show exactly the execution point in source code.
To load the debugger choose the menu System->Extended Debugger->Debugger->Load Debugger. The debugger functions are available in menus only in new built browser.
After loading you can access in menu System->Extended Debugger to 3 new menu items
Browse Breakpoints - invoke Breakpoints Browser
check box menu - activate debugger.
check box menu - invoke debugger by error.
Invoking Debugger
The debugger will be invoked in 3 cases
atk::halt command
active breakpoint
error case (only if check-box in the menu System->Extended Debugger->Start Debugger on Error is set)
 | In this time the only byte compiled code can be debugged. It means eval uplevel and code in global context can be not debugged. |
Debugger Browser
The debugger have 4 panes: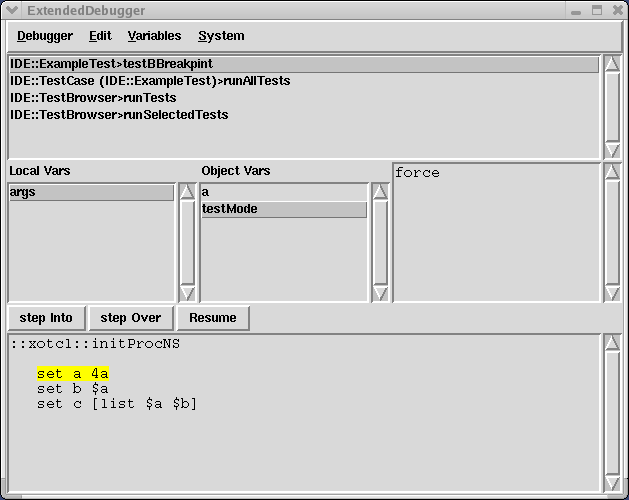
list with call stack levels
list with all local visible variable (info locals)
list with all object variables visible in actual call stack
window for displaying selected variable value
window for showing actual method
Breakpoints Browser
All breakpoints can be browsed and configured with this GUI. The breakpoints views are synchronized (model view controler)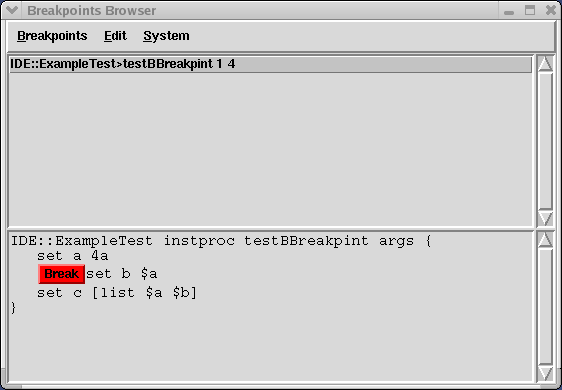
Breakpoint Configuration Editor
You can use this small GUI to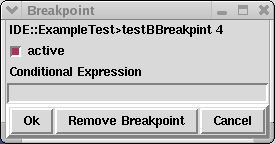
activate breakpoint - the breakpoint will be showed as red button in the source
deactivate breakpoint - the breakpoint will be showed as gray button in the source
setting conditional expression. This script will be evaluated in breakpoint (method) context. If the return result will be true the breakpoint will caused debugger invocation. In another case (false, 0, error) the breakpoint has no effect. Warning the condition is not expression but script. The simplest one were
.[expr 1]